2021-09-13

Bokashi composting, hands on guide

[WIKIPEDIA] Bokashi is a process that converts food waste and similar organic matter into a soil amendment which adds nutrients and improves soil texture. It differs from traditional composting methods in several respects. The most important are:
  • The input matter is fermented by specialist bacteria, not decomposed.
  • The fermented matter is fed directly to field or garden soil, without requiring further time to mature.
  • As a result, virtually all input carbon, energy and nutrients enter the soil food web, having been neither emitted in greenhouse gases and heat nor leached out.
Put it simply, you are preparing food for worms, not the soil itself so this method is suitable for people with gardens.
PROS CONS
No hustle. No soil produced.
No excessive CO2 production. Pungent smell.
Easy to get right.
Does not attract mice/rats/harmful insects.


Chemistry


Please see this Wikipedia article for details.


The HOW


You need to harvest and grow lactobacillus. For this you can basically use any organic food produce like cabbage or rice. I will give receipt for rice (any rice but paraboiled should do):
  • 0.5l of water (non-chlorinated)
  • 70-80g of rice (any except paraboiled, the more the better, rice can be reused for cooking)
  • 15g of sugar (any)
  • 5g of salt (any)

GOTCHA: If you do not have access to non-chlorinated water, please boil tap water and leave it for a day or two before using it.
There is no point in using any special rice, sugar or salt. This is urban myth. I'm guessing paraboiled rice is not fit for this being that most of the useful organisms will die during pre-boiling.
Quantities scale linearly so to make larger batch, just multiply with same number.
When weighing ingridients, it is not important to be exactly precise so, say, rice can be more. But, it is better to have 1g of sugar more than 1g of salt. Meaning, rice 85g, sugar 16g, salt 4g is perfectly good receipt.

Equipment:
  • Plastic bottle with loose cap or fermentor cap such as this one. It is important that a cap is loose because of CO2 buildup while lactobacteria processes sugar to grow.
  • Funnel with sieve to prevent rice grains getting into solution. Impurities will clog nozzle.
  • ph strips covering acidic spectrum (say 1-5).
  • A bowl to mix rice in.
  • Spray bottle.
  • Bokashi bin.
The process:
  • Pour dechlorinated water and rice into bowl. Grind rice grains against each other with your hands until the water is cloudy white. The whiter the better. This should not take more than couple of minutes.
  • Pour half of the mixture into the bottle using funnel.
  • Add salt and sugar into bottle.
  • Pour the rest of the mixture into bottle and close it.
  • Shake the bottle vigorously and place into dark, warm corner.
  • Rinse the bowl and funnel under running tap water.
When it occurs to you, shake the bottle and, if needed, release CO2 from it. This can be once a day or so. Lactobacillus is photo/aerophobic but this just means it will grow slower when aerated/insolated not die altogether.
After 2-3 days, depending on how warm your corner is, you can start checking if there is enough lactobacillus in your mixture. Open the bottle and place pH strip into it for couple of seconds. You are looking for pH value of 4 and less (I usually wait for 3). This is becaus of two things; botulism bacteria naturally occuring in rice die off at about 4.5 and values of 3 and lower indicate "runaway" reaction mening we have almost pure lactobacteria culture. The mixture smells sour.
When the mixture is prepared, pour into spray-bottle, it is ready to use.

Composting:
Open the bin, spray some of the liquid on the sides, put the food leftovers in it, press hard, close. Repeat until bin is full. You can add a spoon of sugar occasionally.
Once the bin is full, leave for some 2 weeks to ferment. Regardless of urban myths, this is not mandatory as the fermentation process will continue even after you bury the contents into ground.
After the maturation, please bury the contents into a hole in earth or dispose into composter. Personally, I have 2 boxes made of thick wire so they have contact with ground attracting worms. Make sure the mixture in composter is always kept wet. This is good for worms and keeps mice away.
Once the bin is empty, you can wash it. I use rain water to preserve what remained of lactobacteria but tap water is also fine. Drain fully for a day or so especially if you washed it with tap water.
The soil is ready to be used when there are no discernible pieces of food in it any more. Take this with grain of salt, of course you can see some pieces of food, depending on type of food and how big the pieces were. This does not make soil unusable in any way.

Finer points of the process and what to watch for:


It is important to press the mixture in the bin firmly to get rid of excess air. This will also crush, for example, eggshells and similar. The pieces should be small enough not to trap air in them. In normal language; I chop orange/lemon peels into several pieces instead of putting citrus dome into bin. On the other hand, cabbage, salad, fish remains etc. I do not cut at all.
It is OK to have pieces of raw flesh in the bin. Once fermented, it will not attract rats and such.
Do not make excessive amount of bokashi mixture. After processing the sugar in it, bacteria will start to die. Generally, if I have mixture for more than 10 days, I add a few grams of sugar directly to spray bottle and shake.
You can put anything but the bones and nut shells into the bin. Lactobacteria will eat through even fish bones and egg shells.
If you ever wondered why the pipe on the bin, it is because liquid is produced during fermentation. You need to relieve this liquid from the bin so it does not soak the contents. Mind you, the smell is pungent! The liquid obtained can be diluted and used as fertilizer or simply poured into pipes, earth, compost bin, septic tank and so on. The warmer the place for the bin, the more liquid is produced! Bacteria count drops by half with each degree Celsius drop in temperature.
GOTCHA:
Harmful mold can develop in the bin if you fail to drain it! If you open the lid and see black mold on top, take the bin somewhere far and pour the contents over the ground. Do not bury it as we want the elements to do the desinfection for us. This goes for the bin too. On the other hand, if you see webby-white mold in the bin, that's perfectly fine, even desirable.
Earth worms are not very active below 20C so it will take more time for them to process the food in winter.

The RESULT

Dense, black soil-like matter teaming with worms and other living things. It can significantly improve soil quality in your garden, flower pots etc.

2018-06-01

MySQL Cluster 7.6GA in the Cloud: the RPM/YUM platform

In this series of blogs I will do my best to demonstrate how to set up and run Cluster in Cloud environment by hand and by utilizing MCC. For detailed configuration, I will use MCC (Auto-installer). Some of the information regarding this setup is provided in post by Mikael. Information regarding Auto-installer is available in our documentation, HTML help files in share/MCC distribution directory and in my blog post.

Cloud setup

It might come as surprise but for initial testing any instance should do. I started with 1CPU/1GB RAM ones. The target topology was:
  • Host #1: Management node and Cluster client tools.
  • Host #2: Multi-threaded DATA node.
  • Host #3: Multi-threaded DATA node.
  • Host #4: SQL node (MySQL server)/API node.
  • Host #5: SQL node (MySQL server)/API node.


Cloud instances:
At your provider of choice, set up topology as described. Most of the providers prefer using keys so set the security and save the key to your local box. After that, set the firewall rules. Here is the list of ports with explanation for this example:
  • Port#1186: Port used by management node for communication. It is also used by MCC to connect to Management node host and gather status from/shut down the Cluster. Open it on host #1.
  • Port#11860: "ServerPort" used by DATA nodes to communicate with each other. Open it on hosts 2 and 3.
  • Port#3306: Standard MySQL server port. You need to open it on hosts 4 and 5.
To open ports via script, please check Mikael's post.
GOTCHA: Port 3306 on hosts 4 and 5 could already be taken by existing MySQL server installation which you might remove first or change this port to, say, 3316.
$ sudo netstat -tulpn | grep LISTEN
tcp        0      0 0.0.0.0:22              0.0.0.0:*               LISTEN      929/sshd
tcp        0      0 127.0.0.1:25            0.0.0.0:*               LISTEN      894/master
tcp6       0      0 :::3306                 :::*                    LISTEN      983/mysqld
tcp6       0      0 :::22                   :::*                    LISTEN      929/sshd
tcp6       0      0 ::1:25                  :::*                    LISTEN      894/master
$ sudo /sbin/service mysqld stop
Redirecting to /bin/systemctl stop mysqld.service
$ sudo netstat -tulpn | grep LISTEN
tcp        0      0 0.0.0.0:22              0.0.0.0:*               LISTEN      929/sshd
tcp        0      0 127.0.0.1:25            0.0.0.0:*               LISTEN      894/master
tcp6       0      0 :::22                   :::*                    LISTEN      929/sshd
tcp6       0      0 ::1:25                  :::*                    LISTEN      894/master

GOTCHA: Usually, MySQL Cluster DATA node will look for available port and auto-assign ServerPort. However, it is most likely that your Cloud firewall will block everything but specific ports so this value is needed.
If you have localhost deployment or you have two or more DATA nodes on same host, do not assign this value.

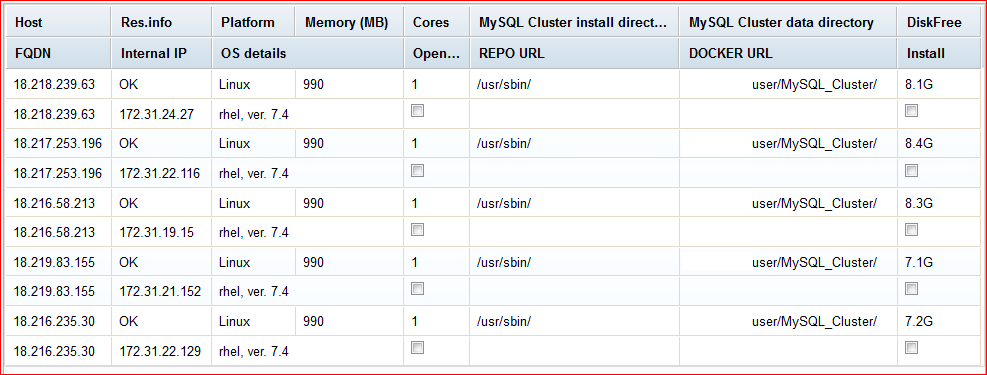
After dealing with security and choosing your preferred OS, make note of both public and private IP addresses. Public one we will use to control the processes from MCC while private ones will be used by processes for inter-communication bypassing DNS service:

NOTE: The "Open..." refers to "OpenFirewall" field of Host configuration.

Preparing the host(s)

If you're using MCC, you can configure all the processes and options and create directories/deploy configurations by clicking DEPLOY button on last page.
If you want to do things by hand, please, in your HOME, prepare the directories:
mkdir ndb (or MySQL_Cluster)
cd ndb
mkdir data
cd ..
Place the config.ini file in MGMT node(s) DATADIR you just created (~/ndb/data), place my.cnf in DATADIR on hosts 4 and 5. I will talk of config.ini more later.

Prepare the utilities:
sudo yum update
sudo yum install curl wget unzip zip
Get the RPM and extract:
wget https://dev.mysql.com/get/mysql57-community-release-el7-11.noarch.rpm
sudo rpm -ivh mysql57-community-release-el7-11.noarch.rpm
Check things:
rpm -qa | grep mysql                              mysql57-community-release-el7-11.noarch
The default values in MySQL repository file enable MySQL server but we need Cluster so change "enabled" value using your favorite editor:
cat /etc/yum.repos.d/mysql-community.repo
[mysql57-community]
name=MySQL 5.7 Community Server
baseurl=http://repo.mysql.com/yum/mysql-5.7-community/el/7/$basearch/
enabled=1 <<<<< 0
gpgcheck=1
gpgkey=file:///etc/pki/rpm-gpg/RPM-GPG-KEY-mysql

[mysql-cluster-7.6-community]
name=MySQL Cluster 7.6 Community
baseurl=http://repo.mysql.com/yum/mysql-cluster-7.6-community/el/7/$basearch/
enabled=0 <<<<< 1
gpgcheck=1
gpgkey=file:///etc/pki/rpm-gpg/RPM-GPG-KEY-mysql
or by issuing:
sudo yum-config-manager --disable mysql57-community
sudo yum-config-manager --enable mysql-cluster-7.6-community
Make sure everything checks out:
cat /etc/yum.repos.d/mysql-community.repo
[mysql-connectors-community]
...
[mysql57-community]
name=MySQL 5.7 Community Server
baseurl=http://repo.mysql.com/yum/mysql-5.7-community/el/7/$basearch/
enabled=0
gpgcheck=1
gpgkey=file:///etc/pki/rpm-gpg/RPM-GPG-KEY-mysql
...
[mysql-cluster-7.6-community]
name=MySQL Cluster 7.6 Community
baseurl=http://repo.mysql.com/yum/mysql-cluster-7.6-community/el/7/$basearch/
enabled=1
gpgcheck=1
gpgkey=file:///etc/pki/rpm-gpg/RPM-GPG-KEY-mysql
Installing Host#1 for the NDB management server is now easy:
sudo yum install mysql-cluster-community-management-server
To properly stop MySQL Cluster or to play with it from MCC, you will need ndb_mgm client so you can poll for status and execute various commands:
sudo rpm -ivh http://dl.fedoraproject.org/pub/epel/7/x86_64/Packages/e/epel-release-7-11.noarch.rpm
sudo yum install mysql-cluster-community-client
ndb_mgm --ndb-connectstring=172.31.24.27:1186
ndb_mgm> show
Cluster Configuration
---------------------
[ndbd(NDB)]     2 node(s)
id=1 (not connected, accepting connect from 172.31.22.116)
id=2 (not connected, accepting connect from 172.31.19.15)

[ndb_mgmd(MGM)] 1 node(s)
id=49   @172.31.24.27  (mysql-5.7.18 ndb-7.6.3)
...
Note: Perl is needed to install MySQL Cluster community package. To install Perl we need access to the EPEL packages.

Installing the NDB data nodes on Host#2 and #3 is also very easy:
sudo yum install mysql-cluster-community-data-node

MySQL Cluster server package depends on Perl which is not part of a standard Red Hat installation. So on the Host#4 and #5 used for MySQL Server we first need to install support for Perl by installing EPEL packages (Extra Packages for Enterprise Linux) much like we did for MGMT node host (#1). This is performed through the command:
sudo rpm -ivh http://dl.fedoraproject.org/pub/epel/7/x86_64/Packages/e/epel-release-7-11.noarch.rpm
You might need to check which package actually exists.

After installing this, it is straightforward to install the MySQL Server package. This package will also download the MySQL client package that contains the NDB management client package:
sudo yum install mysql-cluster-community-server

Running the Cluster

You can run Cluster by hand or let the MCC deal with it. In any case, the start sequence is MGMT node(s), DATA node(s), SQL node(s) and API node(s). When running by hand, sequence of commands by host are like this:
 ndb_mgmd -f /home/user/ndb/config.ini --initial --configdir=/home/user/ndb/data --ndb-nodeid=49
There are many ways in which you can mix parameters, for example:
ndb_mgmd  --configdir=/home/user/ndb/data/ --config-file=/home/user/ndb/data/49/config.ini
and so on, depending on where DATADIR and config.ini are placed.

Use ndb_mgm client to confirm node is up as described above.

Then start DATA nodes on hosts 2 and 3:
ndbmtd --connect-string="nodeid=1;172.31.24.27" (Host#2)
ndbmtd --connect-string="nodeid=2;172.31.24.27" (Host#3)
Notice how DATA nodes refer to MGMT node internal IP address and represent themselves with node ID found in config.ini file. It is possible to use external IP too but internal one does not depend on DNS service.

Use ndb_mgm client to confirm nodes are up as described above.

Next we bootstrap MySQL server and start it:
mysqld --defaults-file=/home/user/ndb/data/my.cnf --initialize-insecure
mysqld --defaults-file=/home/user/ndb/data/my.cnf --ndb-connectstring=172.31.24.27
Since we are preparing test setup, doing this as root is acceptable. However, you will need a lot of SUDO's later.
GOTCHA: Normally, you would never never leave your MySQL setup unprotected! Please observe procedures noted in our manual and secure your installation:
  • Initialize the data directory by invoking mysqld with the --initialize to let server generate a random initial password for the root@localhost account.
  • On *nix systems, it is important to make sure that the database directories and files are owned by the mysql account so that the server has read and write access to them. To ensure this, start mysqld from the system root account and include the --user option like this:
    $ bin/mysqld --initialize --user=mysql
  • To add mysql user/group please use following commands (or addgroup, adduser depending on the Linux flavor):
    $ groupadd mysql
    $ useradd -r -g mysql -s /bin/false mysql
    Because the user is required only for ownership purposes, not login purposes, the useradd command uses the -r and -s /bin/false options to create a user that does not have login permissions to your server host. Omit these options if your useradd does not support them.

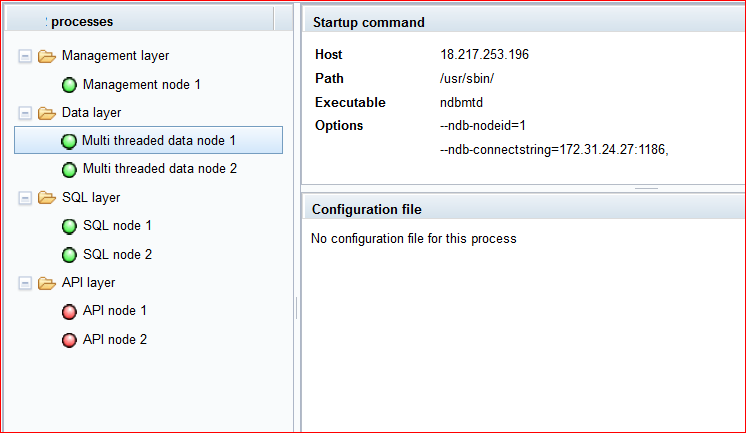
Use ndb_mgm or MCC to confirm Cluster is up and running:

GOTCHA: By default, MCC will set SharedGlobalMemory to 384MB which is too much for microinstance so DATA nodes might not start. Lower this value to 128MB or 256MB, whichever works for you. You can also change LockPagesInMainMemory=0 to LockPagesInMainMemory=1 to make this problem more visible.

config.ini: Assuming you let MCC create configuration and directories for you, ~/ndb/data becomes ~/MySQL_Cluster/NodeID
#
# Configuration file for ...
#

[NDB_MGMD DEFAULT]
ArbitrationRank=1
HeartbeatIntervalMgmdMgmd=1500
Portnumber=1186

[NDB_MGMD]
NodeId=49
HostName=172.31.24.27
DataDir=/home/user/MySQL_Cluster/49/
Portnumber=1186

[TCP DEFAULT]
SendBufferMemory=2M
ReceiveBufferMemory=2M

[NDBD DEFAULT]
NoOfReplicas=1
ServerPort=11860
CompressedLCP=false
LogLevelStartup=1
EventLogBufferSize=8K
DataMemory=4M
IndexMemory=2M
MinFreePct=5
MaxNoOfAttributes=1000
MaxNoOfTables=128
MaxNoOfOrderedIndexes=128
MaxNoOfTriggers=768
MaxNoOfConcurrentSubOperations=256
StringMemory=25
MaxAllocate=32M
Diskless=false
LockPagesInMainMemory=1
ODirect=false
Arbitration=Default
DiskPageBufferEntries=10
DiskPageBufferMemory=128M
MaxNoOfConcurrentTransactions=4096
MaxNoOfConcurrentOperations=131072
MaxNoOfConcurrentScans=256
FragmentLogFileSize=64M
NoOfFragmentLogFiles=4
InitFragmentLogFiles=SPARSE
RedoBuffer=32M
RedoOverCommitCounter=3
RedoOverCommitLimit=20
MaxNoOfExecutionThreads=2
StopOnError=0
CrashOnCorruptedTuple=true
StartFailRetryDelay=0
MaxStartFailRetries=3

[NDBD]
NodeId=1
HostName=172.31.22.116
DataDir=/home/user/MySQL_Cluster/1/

[NDBD]
NodeId=2
HostName=172.31.19.15
DataDir=/home/user/MySQL_Cluster/2/

[MYSQLD DEFAULT]
AutoReconnect=false
BatchByteSize=16K
BatchSize=256
MaxScanBatchSize=256K

[MYSQLD]
NodeId=53
HostName=172.31.21.152

[MYSQLD]
NodeId=54
HostName=172.31.22.129

[API]
NodeId=231
HostName=172.31.21.152

[API]
NodeId=232
HostName=172.31.22.129
I have removed a lot of options MCC sets in [NDBD DEFAULT] section but feel free to play with them.

my.cnf file for SQL node on host 4 looks like:
my.cnf
#
# Configuration file for ...
# Generated by mcc
#
[mysqld]
log-error=mysqld.53.err
datadir="/home/user/MySQL_Cluster/53/data"
tmpdir="/home/user/MySQL_Cluster/53/tmp"
basedir="/usr/sbin/"
port=3306
ndbcluster=on
ndb-nodeid=53
ndb-connectstring=172.31.24.27:1186,
socket="/home/user/MySQL_Cluster/53/mysql.socket"
and same for host 5 only replacing 53 with 54.
GOTCHA: Client programs (ndb_mgm and mysqladmin) do not reside in /usr/sbin/ on RHEL but rather in /usr/bin/ thus MCC now tries sbin, bin and checks if necessary client libs reside in PATH. What this means for you is that now you will be able to check status of Cluster and shut it down from within MCC. To check status you can also SSH to MGMT node host (#1) and use ndb_mgm as described above.

Stopping the Cluster

Either press "Stop Cluster" button in MCC or issue commands by hand in reverse order than the one you used for starting Cluster:
  • SSH to Host#4, issue (sudo) mysqladmin -uroot shutdown
  • SSH to Host#5, issue (sudo) mysqladmin -uroot shutdown
  • SSH to Host#1, issue (sudo) ndb_mgm --ndb-connectstring="172.31.24.27:1186", --execute=shutdown

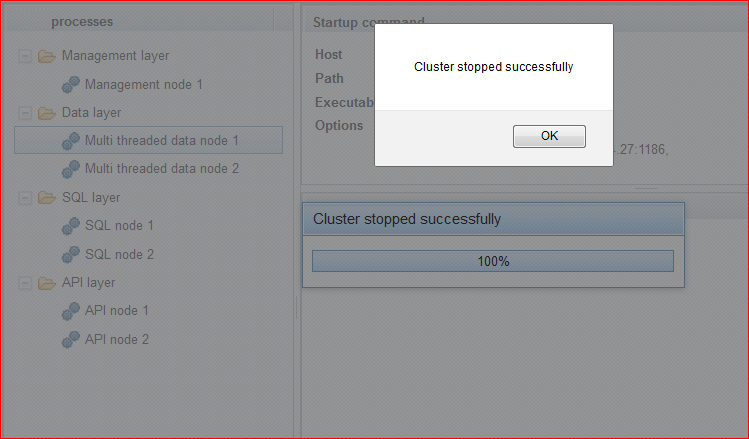
Result should be full cluster stop:


Summary

  • Stop any existing mysqld's and/or change the port for SQL nodes.
  • Open correct ports in firewall, set the authentication for your Cloud deployment.
  • ServerPort needs setting only in multi-host Cloud deployment. Beware that each DATA node residing on same host needs different value!
  • If necessary, update YUM, download tools such as wget.
  • Get MySQL repository, disable Server, enable Cluster.
  • Install MySQL software on hosts according to your topology.
  • Install MySQL Cluster software locally so you get /share/MCC.
  • Recreate topology in MCC using "Add Host" button, putting internal IP address and private key in proper place.
  • If using instances with very limited RAM, set SharedGlobalMemory to 128MB, set LockPagesInMainMemory to 1.
  • Deploy the configuration from MCC so you get all the directories created and configuration files distributed.


  • Next, I will talk of problems encountered, troubleshooting and Docker deployment.

    2018-02-05

    MySQL Cluster 7.6 includes new Cluster Configurator

    After dealing with Windows performance, I switched to MySQL Cluster Configurator (MCC for short) project. This was quite a change for me having to deal with Python back-end and JavaScript front-end, languages I was not so familiar with.

    For the history of the project, please refer to Andrew's blog post for I will concentrate on changes made in new version.

    There are many exciting new features in MySQL Cluster 7.6.4DMR including new MCC. To download MySQL Cluster 7.6.4DMR, please go to Development Releases tab. To see what's new in 7.6.4DMR, please follow this link.

    MySQL Cluster Configurator in short

    With a single command launch the web-based wizard which then steps you through configuring, deploying configuration and starting the cluster; to keep things even simpler, it will automatically detect the resources on your target machines and use these results together with the type of workload you specify in order to determine values for the key configuration parameters.
    The software is part of the MySQL Cluster package (NDB). To run on Windows, just double click setup.bat – note that if you installed from the MSI and didn’t change the install directory then this will be located somewhere like C:\Program Files...\MySQL\MySQL Cluster 7.6. On Linux, just run ndb_setup from the bin folder.
    On Windows, we provide all necessary libraries and the Python while on Linux, you should have Python 2.7 (latest) installed as well as Paramiko 2 or newer. Paramiko will install Cryptography and other required libraries.
    If you launch the installer from a desktop environment shell then the first page of the wizard will automatically open in your web browser, if not then just browse to the URL that is displayed on the command line.
    Recap: Start the Python web server from shell using setup.bat (Windows) or bin/ndb_setup (*nix), JavaScript front-end will be opened for you in default browser. If it's not, copy the link from console to your favorite browser. Make sure you have administrator rights on all the hosts you will use in cluster. Also, make sure to have MySQL Cluster installed on all the boxes making up cluster.
    There is an extensive help file in /hlp/html directory, please read if you're new to product.

    Who is this software for

    Typically, MCC would be used by developers working on Cluster software and people looking for quick evaluation of MySQL Cluster on various hardware configurations including cloud instances.

    New version highlights

    • Multiple reusable configurations. Take your configuration with you to work on different boxes.
    • Much safer configuration files allowing for saving passwords/passphrases resulting in full restoration of NDB Cluster from configuration file.
    • Many new options to configure both for NDB Cluster processes as well as for mysqld. Multiple choice options have proper drop-down lists associated.
    • Many new members in Cluster and Host objects. GUI changes to present them.
    • Nodes can have external IP address (to gain access from MCC for example) as well as internal IP address (for faster and safer communication inside cloud deployment or other VPN environment).
    • Extended ways of authentication such as using different username, private key on per host basis, using keys with passphrases and so on.
    • Better detection of running cluster processes and option to stop them even if startup fails.

    Language choice

    JavaScript was obvious choice since it's common to have GUI run in browser. Due to it's limitations (none likes browser sniffing around file system), we have back-end web server in Python handling various requests related to files, remote hosts etc. Front and back end communicate via POST messages so it is really important that you protect this communication. For a start, we provide self signed certificates for securing it. If you are testing things in sand-box, you may switch https for http to speed up things.
    Recap: Python back end manipulates encryption/decryption, files, connections to local/remote hosts and so on while JavaScript front-end provides GUI in your browser for convenient presentation of configuration options.

    Changes

    Changes in configuration files and authentication methods:

    First change tackled is the configuration. Versions shipped with previous Cluster releases had two major drawbacks; they kept configuration in cookies and could handle just one Cluster configuration which was locked to box where you created it. Keeping Cluster configuration in cookies comes with two major drawbacks; cookies are size-limited and very insecure.
    To remedy this situation, we opted for external configuration file saved in current user's HOME directory (this is done through Python web server that's running MCC); one configuration per file. The file itself is AES encrypted using passphrase provided in front-end and passed down to Python web server via POST message. Passphrase is then kept in memory for the duration of session. With provided passphrase and file name, Python server sends decrypted configuration back to front-end. Configuration is kept in global.windowname variable for the duration of the session.

    This has solved several issues:
    • Configuration now stores all your passwords, passphrases for keys and such allowing for quick and full recreation of Cluster.
    • Extending configuration size allows for per-host credentials. I.e. each host in Cluster can have it's own way of authentication and set of credentials.
    Essentially, when looking for quick and dirty deployment over hosts that use same credentials, it is enough to provide them on Page 2, Cluster Configuration. When working with hosts that have their own separate credentials, you can define them on Host level (Page 3, Add Hosts). We prefer adding hosts on Page 3 via Add Host button to defining them on Page 2 "Host list" box.
    Credentials can be:
    • Username/password.
    • Username/Key name.
    • Username/Key name/Passphrase.
    • Key name/Passphrase.
    • Key name.
    • Nothing.
    If PATH is not provided along with Key name, ~/.ssh is assumed. If using keys and no key name is provided, ~/.ssh/id_rsa is assumed. So, for authentication using standard private key without passphrase stored in default place, you just need to check "Key based SSH" (Page 2, Cluster level) or "Key-based auth" for particular host (Page 3, Add/Edit Host) checkbox and nothing more. If there are absolutely no credentials at host level, program behaves as in old versions meaning whatever was provided on Cluster level is used.

    WARNING: Although asynchronous, call to save configuration changes does take some time to complete. The saving of configuration takes place after pressing "Save&Next" button:

    No changes are saved if you close the tab or browser abruptly! After making extensive changes and pressing Save&Next I like to allow for some time for configuration to be saved. If you open debug console, you will see the notification.
    If you Cluster is all set up and ready to go and you just want to take one more look at various configuration options, you can use breadcrumb buttons as they do not trigger save method:

    Since all credentials are saved, you can skip looking into loaded configuration altogether and go directly to "Deploy configuration" page.
    Gotcha: In order to make configurations portable, we had to limit the usage of "localhost". If you include localhost in your Cluster, you will not be able to add any more remote hosts.
    Gotcha: List with available configurations is provided to front-end upon welcome page load so if you add more configurations to your HOME using external tools they will not be shown (unless you reload page or restart entire program). However, if you choose "New Configuration" and provide the name of existing one, the existing configuration will be loaded.
    Gotcha: "New Configuration" requires you to provide a passphrase and a confirmation. Reading existing configuration just requires passphrase. Please keep your passphrase(s) safe as there is no way to reverse engineer contents of configuration file without it! Each file/configuration can have it's own passphrase.
    Recap: There can be any number of portable, encrypted configurations now which you can find in your HOME on box running MCC. Each host can have it's own way of authentication and a set of credentials. We did our best to guess which auth method and credentials to use based on input provided.

    Changes in Cluster object (Page 2):

    Cluster object has two new attributes:
    • Install MySQL Cluster: Option for installing Cluster on hosts
      NONE: No installation of Cluster will take place (default).
      BOTH: Both DOCKER and installation from REPO will be considered depending on OS and available images. Should both installation mechanisms be available on certain host, we will prefer REPO over DOCKER.
      REPO: For every host in Cluster, the attempt will be made to install Cluster SW from the repository URL.
      DOCKER: For every host in Cluster, the attempt will be made to install Cluster SW DOCKER image.
    • Open FW ports: Check if you need the tool to try to open necessary ports for Cluster processes on every hosts.
    Gotcha: In this version "Install MySQL Cluster" is not functional so you need Cluster installed on all hosts beforehand.

    Changes in Host object and GUI (Page 3):

    Host object has undergone major rework. Host name is now used for external host IP address i.e. IP address at which MCC web server instance can reach that particular host. Host Internal IP refers to that particular host IP address inside VPN. If there is no VPN in play, both IP addresses are the same. We strongly encourage using IP addresses here to skip potential problems with resolving host names.
    Authentication, as per above, could be a) using keys or b) ordinary username/password. If you check Key-based auth when Adding/Editing host and provide nothing, ~/.ssh/id_rsa key will be used without passphrase. You can also define alternate user (to one starting MCC) which comes handy when logging in to domains. Each key can have passphrase and you can provide the path to and name of specific key to use for that host.
    If you check Configure installation, you will be presented with additional fields relating to repository and Docker image. We do our best to provide you with default values based on OS running on particular host you're Adding/Editing.

    We have also added Show/Hide extended host info toggle button switching between single and double line host info representation.

    Changes to Define parameters (Page 5):

    We are constantly adding more configurable parameters to keep up with MySQL server and Cluster evolution but this is a moving target so we ask for patience if certain parameter you'd like to configure is missing.
    In addition to many new configurable parameters, we have extended a GUI so that, for appropriate options, you get drop-down list of allowed values.

    Changes to Deploy configuration (Page 6, last):

    The Start and Stop Cluster buttons now behave more intelligently in terms of determining if the Cluster or any of its processes is running and enabling/disabling appropriate buttons.
    Previously, if Cluster was stuck in any of the startup phases, you had to terminate MCC and kill all the processes on all of the hosts manually. Now, if you think something is wrong, you can close the progress window and it will give control back to MCC enabling Stop Cluster button which you can then press to stop the stray processes properly. It will also provide you with list of log files which you can then check for problems.
    Stopping mysqld process(es) might not work if you changed the credentials from command line.


    These changes are available in version 7.6.4DMR and up. We encourage you to try MCC and MySQL Cluster in your environment!

    2016-06-29

    Working with more than 64 CPUs in Powershell

    Wrote this several months ago but was too busy to publish :-/

    As noted in one of the previous blog post, I will use following terminology:
    • "Processor" is a piece of hardware you connect to a socket on the motherboard.
    • "Physical Core" is a physical computing unit built into the "Processor".
    • "Virtual Core" is a virtual computing unit built on top of "Physical Core" (i.e. HT is ON).
    • "CPU" is a computing unit inside the "Processor", either physical or virtual.

    After a series of blogs on Windows performance counters and after releasing sysb.ps1 testing/benchmarking framework version 0.9RC (dbt2-0.37.50.10) I set out to eliminate some unknowns from the testing. First to tackle was Kernel scheduler in an effort to run processes, from inside the Powershell script, on controlled subset of CPUs much like TASKSET does on Linux. Also worth noting is that proximity rocks, on occasion, meaning you can get up to 20% better results when the workload is distributed perfectly. However, this is hard to achieve thus I'm more going after consistency in test environment.
    This posed quite a bit of challenges; knowing the details of hardware, NUMA node assignments, finding out and evaluating various ways of controlling the CPU pinning to calculating CPU affinity mask for more than 64 CPUs.
    One interesting challenge was to calculate the CPU indexes for MySQL Cluster thread config.
    As a first step, I had to find out as much as possible about my hardware.

    Know your hardware:

    PS> Get-CimInstance Win32_BIOS
    SMBIOSBIOSVersion : 11018100   
    Manufacturer      : American Megatrends Inc.
    Name              : Default System BIOS
    SerialNumber      : 1207FMA00C            
    Version           : SUN    - 20151001
    
    PS> Get-CimInstance Win32_ComputerSystem | FL *
    Status                      : OK
    Name                        : HEL01
    Roles                       : {LM_Workstation, LM_Server, NT, Server_NT}
    AutomaticManagedPagefile    : False
    DomainRole                  : 3
    HypervisorPresent           : False
    Manufacturer                : Oracle Corporation 
    Model                       : Sun Fire X4800
    NetworkServerModeEnabled    : True
    NumberOfLogicalProcessors   : 96
    NumberOfProcessors          : 8
    PartOfDomain                : True
    SystemType                  : x64-based PC
    TotalPhysicalMemory         : 549746266112
    
    PS> Get-CimInstance Win32_ComputerSystemProcessor | FL *
    GroupComponent        : Win32_ComputerSystem (Name = "HEL01")
    PartComponent         : Win32_Processor (DeviceID = "CPU0")
    CimClass              : root/cimv2:Win32_ComputerSystemProcessor
    CimInstanceProperties : {GroupComponent, PartComponent}
    ...
    PartComponent         : Win32_Processor (DeviceID = "CPU1")
    PartComponent         : Win32_Processor (DeviceID = "CPU2")
    PartComponent         : Win32_Processor (DeviceID = "CPU3")
    PartComponent         : Win32_Processor (DeviceID = "CPU4")
    PartComponent         : Win32_Processor (DeviceID = "CPU5")
    PartComponent         : Win32_Processor (DeviceID = "CPU6")
    PartComponent         : Win32_Processor (DeviceID = "CPU7")
    
    PS> Get-CimInstance Win32_PerfFormattedData_PerfOS_NUMANodeMemory
    Name                      : 0
    AvailableMBytes           : 64530
    FreeAndZeroPageListMBytes : 63989
    StandbyListMBytes         : 541
    TotalMBytes               : 65526
    ...
    Name                      : 7
    AvailableMBytes           : 64600
    FreeAndZeroPageListMBytes : 64387
    StandbyListMBytes         : 213
    TotalMBytes               : 65536
    
    PS> Get-CimInstance Win32_SystemSlot
    SlotDesignation : EM00 PCIExp
    Tag             : System Slot 0
    SupportsHotPlug : True
    Status          : OK
    Shared          : True
    PMESignal       : True
    MaxDataWidth    : 8
    ...
    SlotDesignation : EM01 PCIExp
    Tag             : System Slot 1
    SlotDesignation : EM30 PCIExp
    Tag             : System Slot 2
    SlotDesignation : EM31 PCIExp
    Tag             : System Slot 3
    SlotDesignation : EM10 PCIExp
    Tag             : System Slot 4
    SlotDesignation : EM11 PCIExp
    Tag             : System Slot 5
    SlotDesignation : EM20 PCIExp
    Tag             : System Slot 6
    SlotDesignation : EM21 PCIExp
    Tag             : System Slot 7
    
    PS> Get-CimInstance Win32_PerfFormattedData_Counters_ProcessorInformation
    Name                        : 0,0
    PercentofMaximumFrequency   : 100
    PercentPerformanceLimit     : 100
    PercentProcessorPerformance : 69
    ProcessorFrequency          : 2001
    ...
    Name                        : 0,11
    ---
    Name                        : 7,0
    PercentofMaximumFrequency   : 100
    PercentPerformanceLimit     : 100
    PercentProcessorPerformance : 72
    ProcessorFrequency          : 2001
    ...
    Name                        : 7,11
    
    Or, in short, my test box has 2 Processor groups with 48 CPUs each. This makes for Max. CPU affinity mask of 281474976710655d (or 111111111111111111111111111111111111111111111111b). The total number of CPUs is 96, total number of sockets and NUMA nodes is 8.

    Note: Notice there are exactly 48 "1" in Max CPU Affinity mask which is the number of CPUs in each Processor group. This implies you can only set process affinity mask on per Processor group basis, not machine-wide! This limitation is caused by CPUs affinity mask being 64 bits long.
    Groups, NUMA nodes etc. assignments are not chiseled in stone. Please see MSDN for details on how to manipulate these settings.

    Once done playing with WMI, you can turn to coreinfo from Sysinternals suite as it's extremely informative:
    Intel(R) Xeon(R) CPU           E7540  @ 2.00GHz
    Intel64 Family 6 Model 46 Stepping 6, GenuineIntel
    Microcode signature: 00000009
    HTT        * Hyperthreading enabled
    HYPERVISOR - Hypervisor is present
    VMX        * Supports Intel hardware-assisted virtualization
    SVM        - Supports AMD hardware-assisted virtualization
    X64        * Supports 64-bit mode
    
    SMX        - Supports Intel trusted execution
    SKINIT     - Supports AMD SKINIT
    ...
    
    Important to notice is that, in my configuration, Sockets map to NUMA nodes 1-1:
    Logical Processor to Socket Map:                  Logical Processor to NUMA Node Map:
    Socket 0:                                         NUMA Node 0:
    ************------------------------------------  ************------------------------------------
    ------------------------------------------------  ------------------------------------------------  
    Socket 1:                                         NUMA Node 1:
    ------------------------------------------------  ------------------------------------------------
    ************------------------------------------  ************------------------------------------
    Socket 2:                                         NUMA Node 2:
    ------------************------------------------  ------------************------------------------
    ------------------------------------------------  ------------------------------------------------
    Socket 3:                                         NUMA Node 3:
    ------------------------------------------------  ------------------------------------------------
    ------------************------------------------  ------------************------------------------
    Socket 4:                                         NUMA Node 4:
    ------------------------************------------  ------------------------************------------
    ------------------------------------------------  ------------------------------------------------
    Socket 5:                                         NUMA Node 5:
    ------------------------------------------------  ------------------------------------------------
    ------------------------************------------  ------------------------************------------
    Socket 6:                                         NUMA Node 6:
    ------------------------------------************  ------------------------------------************
    ------------------------------------------------  ------------------------------------------------
    Socket 7:                                         NUMA Node 7:
    ------------------------------------------------  ------------------------------------------------
    ------------------------------------************  ------------------------------------************
    
    so I can use Processor/Socket/NUMA node as though they are synonyms. Also, notice that NUMA node/Socket 0 and even ones are in Processor group 0 while odd sockets are in Processor group 1. Here is how CPU utilization looks like in Task manager/Performance tab when just ProcessorGroup 0 is used:

    Logical Processor to Group Map:
    Group 0:                                          Group 1:
    ************************************************  ------------------------------------------------
    ------------------------------------------------  ************************************************
    Note: Coreinfo provides NUMA nodes latency too:
    Approximate Cross-NUMA Node Access Cost (relative to fastest):
         00  01  02  03  04  05  06  07
    00: 1.4 1.7 2.1 1.7 1.7 2.1 2.2 2.1
    01: 1.7 1.4 1.7 2.1 2.1 1.7 2.0 1.3
    02: 2.1 1.7 1.4 1.7 2.1 2.1 1.6 1.2
    03: 1.8 2.1 1.7 1.4 2.1 2.1 2.0 1.1
    04: 1.7 2.1 2.1 2.1 1.4 1.7 1.7 1.4
    05: 2.1 1.7 2.1 2.1 1.7 1.4 2.0 1.0
    06: 2.1 2.1 1.7 2.1 1.7 2.1 1.4 1.3
    07: 2.1 2.1 2.1 1.7 2.1 1.7 1.6 1.0
    

    The software:

    Primary tool used is sysb.ps1 Powershell script version 1.0 (not available for download atm). Version 0.9x RC is available for download and placed in dbt2-0.37.50.10.tar.gz\dbt2-0.37.50.10.tar\dbt2-0.37.50.10\windows_scripts\sysb-script\ directory.

    OS details:
    PS:518 [HEL01]> Get-CimInstance Win32_OperatingSystem | FL *
    Status                                    : OK
    Name                                      : Microsoft Windows Server 2012 R2 Standard
    FreePhysicalMemory                        : 528660256
    FreeSpaceInPagingFiles                    : 8388608
    FreeVirtualMemory                         : 537242324
    Distributed                               : False
    MaxNumberOfProcesses                      : 4294967295
    MaxProcessMemorySize                      : 137438953344
    OSType                                    : 18
    SizeStoredInPagingFiles                   : 8388608
    TotalSwapSpaceSize                        : 
    TotalVirtualMemorySize                    : 545250196
    TotalVisibleMemorySize                    : 536861588
    Version                                   : 6.3.9600
    BootDevice                                : \Device\HarddiskVolume1
    BuildNumber                               : 9600
    BuildType                                 : Multiprocessor Free
    CodeSet                                   : 1252
    DataExecutionPrevention_32BitApplications : True
    DataExecutionPrevention_Available         : True
    DataExecutionPrevention_Drivers           : True
    DataExecutionPrevention_SupportPolicy     : 3
    Debug                                     : False
    ForegroundApplicationBoost                : 2
    LargeSystemCache                          : 
    Manufacturer                              : Microsoft Corporation
    OperatingSystemSKU                        : 7
    OSArchitecture                            : 64-bit
    PAEEnabled                                : 
    ServicePackMajorVersion                   : 0
    ServicePackMinorVersion                   : 0
    

    So how do the Windows work?

    Process is just a container for threads doing the work providing you with fancy name, PID etc. This effectively means you can not calculate "System load" like on Linux. This also explains why there is no ProcessorGroup member attached to Process class while there is one for Threads. This also makes all sorts of problems regarding CPU utilization as described in previous blogs here and here.
    Processor group is a collection of up to 64 CPUs as explained here and here.
    Thread is a basic unit of execution. Setting the Thread affinity will influence the Process class and dictate what you can do with it. There is a great paper on this you can download from MSDN to figure it out. The focus of this blog is on scripting.


    Know the OS pitfalls:

    The setup: I have a script acting as testing/benchmarking framework. Script controls the way processes are launched, collects data from running processes and generally helps me do part of my job of identifying performance issues and testing solutions.
    The problem: Windows is thread based OS and I can not control the threads in binary from within the script.
    Next, .NET System.Diagnostics.Process class does not expose Processor group bit. This means there is no way to control Processor group and thus no way to guarantee the kernel scheduler will start all of your processes inside the Processor group you want :-/ I consider this a bug and not deficiency in Windows because of the following scenario:
       "ProcessA" is pinned, by scheduler, to Processor group 0 with ability to run on all CPUs within that group.
       "ProcessB" is pinned, by scheduler, to Processor group 1 with ability to run on all CPUs within that group.
       ProcessorAffinity member of System.Diagnostics.Process class is the same in both cases!
      $procA = Get-Process -Name ProcessA
      $procA.ProcessorAffinity
      281474976710655 #For my 48 CPUs in each Processor group.
    
      $procB = Get-Process -Name ProcessB
      $procB.ProcessorAffinity
      281474976710655 #For my 48 CPUs in each Processor group.
    
    This leads you to believe that both processes run in the same Processor group, which might not be true as the information is ambiguous. I have set up mysqld to run on 1st NUMA node and part of second (12 + 8 CPUs). At the same time, Sysbench is pinned to NUMA node 0, last 4 CPUs. When scheduler decides to run mysqld on Processor group 1, the CPU load distribution is like this:
    NUMA #0, last 4 CPUs lit up by Sysbench. NUMA #1 and part of 3, lit up by mysqld.

    Using the same(!) Process.ProcessorAffinity for mysqld for subsequent run but this time the scheduler decides it will run mysqld on Processor group 0:
    NUMA #0, last 4 CPUs lit up by Sysbench and mysqld.
    NUMA #2 in part lit up by mysqld.

    It is obvious how later case will most likely produce much lower results since mysqld is competing with Sysbench (on last 4 CPUs of the NUMA node 0) and Windows (first 2 CPUs of NUMA node 0). This is indicative of 2 things:
      a) Microsoft rushed solution for big boxes (> 64 CPUs) and it is not mature nor will it scale.
      b) You can not trust Kernel scheduler to do the right thing on its own as it has no clue as to what will be your next move.
    I might add here that even the display in Task manager lacks the ability to display CPU load per ProcessorGroup...

    Before you send me to RTFM and do this the "proper" way, please notice that the CPU usage pattern for NUMA nodes 5 and 7 is the same in both runs. This is because our Cluster knows how to pin threads to CPUs "properly". Alas, I do not think this is possible from the Powershell.
    Also notice the lack of ProcessorGroup member in System.Diagnostic.Process class. I expected at least ProcessorGroup with getter function (if not complete getter/setter) so I can break the run if scheduler makes the choice I'm not happy with.
    The last problem to mention is late binding of Affinity mask :-/. The code might look like this:
    
        $sb_psi = New-object System.Diagnostics.ProcessStartInfo 
        $sb_psi.CreateNoWindow = $true 
        $sb_psi.UseShellExecute = $false 
        $sb_psi.RedirectStandardOutput = $true
        $sb_psi.RedirectStandardError = $true
        $sb_psi.FileName = "$PathToSB" + '\sysbench.exe '
        $sb_psi.Arguments = @("$sbArgList") 
    
        $sb_process = $null
        $sb_process = New-Object System.Diagnostics.Process 
        $sb_process.StartInfo = $sb_psi
        [void]$sb_process.Start() <<<<
        #Now you can set the Affinity mask:
        $sb_process.ProcessorAffinity = $SCRIPT:SP_BENCHMARK_CPU
        $sb_process.WaitForExit()
    
    IMO, process.ProcessorAffinity should go to System.Diagnostics.ProcessStartInfo.
    I can't help but to wonder what will happen if Intel decides to release single processor with 64+ CPUs?


    What are our options in Powershell then?

    Essentially, you can use 3 techniques to start the process in Powershell and bind it to CPUs but you have to bear in mind that this is not what Microsoft expects you to do so each approach has its pro's and con's:
    1) Using START in cmd.exe (start /HIGH /NODE 2 /AFFINITY 0x4096 /B /WAIT E:\test\...\sysbench.exe --test=oltp...)
    Settings:
     sysbench.conf:
      BENCHMARK_NODE=5
      BENCHMARK_CPU="111100000000" # Xeon E7540 has 12 CPUs per socket so I'm running on LAST 4 (9,10,11 and 12).
    These options allow user to run Sysbench on certain NUMA node as well as certain CPUs within that NUMA node.
    
     autobench.conf:
      SERVER_NUMA_NODE=3
      SERVER_CPU="111111111" #(Or, 000111111111) Running on first 9 CPUs.
     It is not necessary to set CPUs to run on if you're running on entire dedicated NUMA node.
    
    Pros: Works.
    Cons: The process you're starting is not the expected one (say, benchmark) but rather cmd.exe START.
          Cumbersome.
          Not really "Powershell-way".
          Process is bound to just one NUMA node which is fine if it's not hungry for more CPU power.
    

    2) Using .NET System.Diagnostics.Process (PS, C#):
     $process = Start-Process E:\test\mysql-cluster-7.5.0-winx64\bin\mysqld.exe -ArgumentList "--standalone --console
     --initialize-insecure" -WindowStyle Hidden -PassThru -Wait -RedirectStandardOutput e:\test\stdout.txt
     -RedirectStandardError e:\test\stderr.txt
     $process.ProcessorAffinity = 70368739983360
    
     Affinity mask means mysqld runs on NUMA node 7, 5 and part of 3 (0-based index)
     IF ProcessorGroup is set to 1 by Kernel scheduler:
     001111111111111111111111110000000000000000000000 = 70368739983360
     |___________________48 CPUs____________________|
     |__________||__________||__________||__________|
       NUMA #7      NUMA #5    NUMA #3      NUMA #1
    
    Settings:
     Autobench.conf:
      SP_SERVER_CPU=70368739983360
    
     Sysbench.conf:
      SP_BENCHMARK_CPU=211106232532992
      #Run on NUMA node 7, last 2 CPUs, 110000000000000000000000000000000000000000000000b
    
    Pros: Real "Powershell-way" of doing things.
          Process can span over more than 1 NUMA node.
          Good control of the process (HasExited, ExitTime, Kill, ID (PID) ...).
    Cons: Late binding; i.e. process has to be up and running for you to pin it to CPUs. This presents a problem with processes
          that start running immediately.
          No way to control Processor group meaning there is no way to guarantee the kernel scheduler will start all of your
          processes inside the desired Processor group.
    Note: Using -PassThru ensures you will get Process object. Otherwise, Start-Process cmdlet has no output. Also, you can start the process and then use Get-Process -Name... to accomplish the same.

    Not available in Powershell AFAIK but important to understand if using MySQL Cluster:
    3) Hook the threads to CPUs. Since this is not available from the "outside", I will use the Cluster code to do the work for me:
    config.ini
    ----------
    NoOfFragmentLogParts=10
    ThreadConfig=ldm={count=10,cpubind=88-91,100-105},tc={count=4,cpubind=94-95,106-107},send={count=2,cpubind=92-93},
    recv={count=2,cpubind=98,99},main={count=1,cpubind=109},rep={count=1,cpubind=109}
    
    sysbench.conf
    -------------
    #NUMA node to run sysbench on.
    BENCHMARK_NODE=0
    #Zero based index.
    #CPUs inside selected NUMA node to run sysbench on.
    BENCHMARK_CPU="111100000000"
     000000001111
     |__________|
     |_12 CPUs__|
       NUMA #0
    CPU0   CPU11
    
    autobench.conf
    --------------
    SP_SERVER_CPU=1048575
     Affinity mask means mysqld runs on NUMA node 7, 5 and part of 3 (0-based index) IF ProcessorGroup is 1:
     001111111111111111111111110000000000000000000000 = 70368739983360d
     |___________________48 CPUs____________________|
     |__________||__________||__________||__________|
       NUMA #7      NUMA #5    NUMA #3      NUMA #1
    
    Test image shows
     000000000000000000000000000011111111111111111111 = 1048575d
     |___________________48 CPUs____________________|
     |__________||__________||__________||__________|
       NUMA #7      NUMA #5    NUMA #3      NUMA #1
    
    Sysbench is running on NUMA #0, last 4 CPUs.
    MySQLd is running on NUMA #1 and last 8 CPUs of NUMA #3.
    LDM threads are running on first 4 CPUS node #5 together with 2 TC, SEND and RCV threads.
    LDM threads are running on first 6 CPUS node #7 together with 2 TC and 1 MAIN and REPL
    threads with CPUs 107 and 110(Last one) not being used.


    Calculating ProcessorAffinity mask for process is different depending on the function accepting the input.
    1) For cmd.exe START, the actual number passed is in HEX notation. The binary mask is composed so that the highest index CPU comes first:
    BENCHMARK_CPU="111100000000"
     000000001111
     |__________|
     |_12 CPUs__|
       NUMA #0
    CPU0     CPU11
    It is more convenient to provide the mask in binary so I convert setting to Hex value inside the script.
    The NUMA node to run on is specified as decimal integer.
    If you have provided the NUMA node # for the process to run on, not specifying ProcessorAffinity mask means "run on all CPUs within specified node".
    If you provide the wrong mask, process will fail to start. For example, I have 12 CPUs per NUMA node (socket) so providing the mask like "11111111111000" will fail.
    The approach works only on one NUMA node.

    2) Start Process expects decimal integer for mask. The rightmost "1" indicates usage of CPU #0 within Processor group assigned by Kernel scheduler in Round-Robin manner.
     000000000000000000000000000011111111111111111111 = 1048575d
     |___________________48 CPUs____________________|
     |__________||__________||__________||__________|
       NUMA #7      NUMA #5    NUMA #3      NUMA #1
    or, should the scheduler pick Processor group 0:
       NUMA #6      NUMA #4    NUMA #2      NUMA #0
    
    Start process takes (and returns) decimal value for ProcessorAffinity.
    It uses late binding so Process has to be up and running before assigning Affinity mask to it.
    You have no control over ProcessorGroup meaning Kernel scheduler is free to pick any NUMA node in Round-Robin fashion.

    3) Doing things "properly" (binding threads to CPUs). Or, how to calculate ThreadConfig for MySQL Cluster:
    ThreadConfig=ldm={count=10,cpubind=88-91,100-105},tc={count=4,cpubind=94-95,106-107},send={count=2,cpubind=92-93},recv={count=2,cpubind=98,99},main={count=1,cpubind=109},rep={count=1,cpubind=109} shows CPU indexes above total number of CPUs available on my test system (2x48=96). This has to do with the maximum capacity of Processor group which is 64. The designer of this functionality treats each Processor group found on system as full meaning it occupies 64 places for CPU index. This makes sense if you are going from the box with 48 CPUs in group (like mine) to a box with 64 CPUs in group as your ThreadConfig line will continue to work as expected. However, it requires some math to come to CPU indexes:
    
    Processor group 0                                              |Processor group 1
    CPU#0                                    CPU#47          CPU#63CPU#64                                    CPU#110       CPU#127
    |                  AVAILABLE                  |     RESERV    ||                   AVAILABLE                 |     RESERV    |
    XXXXXXXXXXXXXXXXXXXXXXXXXXXXXXXXXXXXXXXXXXXXXXXRRRRRRRRRRRRRRRRXXXXXXXXXXXXXXXXXXXXXXXXXXXXXXXXXXXXXXXXXXXXXXXRRRRRRRRRRRRRRRR
    Now my ThreadConfig line makes sense:
    LDM threads are running on first 4 CPUS node #5 (88-91) together with 2 TC (94,95), SEND (92,93) and RCV (98,99) threads.
    LDM threads are running on first 6 CPUS node #7 (100-105) together with 2 TC (106,107) and 1 MAIN and REPL (109)
    threads with CPUs 107 and 110(Last one) not being used.


    Conclusion:

    o Windows use notion of Processor group. Machines with less than 64 CPUs have 1 Processor group thus your application runs exactly as before.
      o Bug 1: Affinity mask is only 64-bit wide so there is no way to have continuous index of CPUs inside the big box such as mine.
    o .NET System.Diagnostics.Process has no get/set of Processor group. At least a getter function was expected and a member of System.Diagnostics.Process disclosing this information.
      o Bug 2: Information on CPU Affinity mask obtained from .NET System.Diagnostics.Process is ambiguous.
    o 1 + 2, bug 3: There is no way I found to script pinning to individual CPUs that is complete.
      o Feature request 1: .NET System.Diagnostics.Process allows only for late binding of Affinity mask. Move Affinity to .NET System.Diagnostics.ProcessStartInfo.
    o Feature request 2, consolidate: The various approaches taken by Microsoft seem uncoordinated and incomplete. Even using START command requires decimal number for NUMA node index and hexadecimal number for Affinity mask. cmd.exe START and creation of thread objects allow for early binding of CPU Affinity mask while .NET System.Diagnostics.Process allows only late binding. And so on.
    o Feature request 3, give us TASKSET complement: Given all of the above, it is impossible to script the replacement for Linux TASKSET.
    o What will happen once single processors with more than 64 CPUs are available?
    o Mysql Cluster counts CPUs as if every existing Processor group is complete (has 64 CPUs).


    2016-02-29

    Linux top command on Windows, further investigations

    In my previous post, I spoke of "Normalized" and "Non-Normalized" CPU utilization values:
    --

    TABLE:

    Foreword: Windows is not "process" based OS (like Linux) but rather "thread" based so all of the numbers relating to CPU usage are approximations. I did made a "proper" CPU per Process looping and summing up Threads counter (https://msdn.microsoft.com/en-us/library/aa394279%28v=vs.85%29.aspx) based on PID but that proved too slow given I have ~1 sec to deal with everything. CPU utilization using RAW counters with 1s delay between samples proved to produce a bit more reliable result than just reading Formatted counters but, again, too slow for my 1s ticks (collect sample, wait 1s, collect sample, do the math takes longer than 1s). Thus I use PerfFormatted counters in version 0.9RC.
        Win32_PerfRawData_PerfProc_Process; Win32_PerfFormattedData_PerfProc_Process.
      
        _PID_     Unique identified of the process.
        PPID      Unique identifier of the process that started this one.
        PrioB     Base priority.
        Name      Name of the process.
        CPUpt_(N) % of CPU used by process. On machines with multiple CPUs,
            this number can be over 100% unless you see _CPUpt_N caption which
            means "Normalized" (i.e. CPUutilization / # of CPUs).
            Toggle Normal/Normalized display by pressing the "p" key.
        Thds      # of threads spawned by the process.
        Hndl      # of handles opened by the process.
        WS(MB)    Total RAM used by the process. Working Set is, basically,
            the set of memory pages touched recently by the threads belonging to
            the process. 
        VM(MB)    Size of the virtual address space in use by the process.
        PM(MB)    The current amount of VM that this process has reserved
            for use in the paging files.
    
    However, my approach for displaying "Non-Normalized" CPU utilization didn't work :-/

    Proper functionality of this feature is rather important for my job. Looking at "Normalized" CPU utilization values for a process does not tell you much. Say a process has CPU utilization of 100%. This just tells you there is at least 1 CPU that's fully utilized by the process but it does not tell you the overall utilization. "Non-Normalized" value sums CPU utilization over all CPUs that process uses. In my case, the test box has 8 Xeon processors with 6 physical and 6 virtual cores each totaling at 96 CPUs. The system is configured as such that NUMA node corresponds to 1 Xeon processor (socket). Thus, when my process utilizes entire NUMA node (socket) to the fullest, the CPU utilization for that process should be number of CPUs per Numa/Socket (12) x 100% which is 1200%:


    If the process scales correctly, I will see more NUMA nodes/Sockets light up while increasing the load:

    However, this does not tell me it is my process of interest that is using the CPUs. To confirm it, I need TOP script showing CPU utilization of above 1200%:

    This guarantees me mysqld process is running on more than 2 sockets (sysbench is taking up ~7 CPUs and I bet mydesktopservice is the one lighting up 3rd CPU in 2nd row).

    How to make it work:

    Heavy rework of #region Tasks job which is starting the "Processes" monitoring job was in order. First, I had to remove all of the below code:
    <#
            if ($CPUDSw) {
                Get-CimInstance Win32_PerfFormattedData_PerfProc_Process | 
                    select @{Name='_PID_'; Expression={$_.IDProcess}},
                    @{Name='PPID'; Expression={$_.CreatingProcessID}},
                    @{Name='PrioB'; Expression={$_.PriorityBase}},
                    @{Name='Name                  '; Expression={(($_.Name).PadRight(22)).substring
                        (0, [System.Math]::Min(22, ($_.Name).Length))}}, 
                    @{Name='_CPUpt__'; Expression={($_.PercentProcessorTime).ToString("0.00").PadLeft(8)}},
                    @{Name='Thds'; Expression={$_.ThreadCount}},
                    @{Name='Hndl'; Expression={$_.HandleCount}},
                    @{Name='WS(MB)'; Expression={[math]::Truncate($_.WorkingSet/1MB)}},
                    @{Name='VM(MB)'; Expression = {[math]::Truncate($_.VirtualBytes/1MB)}},
                    @{Name='PM(MB)'; Expression={[math]::Truncate($_.PageFileBytes/1MB)}} |
                    where { $_._PID_ -gt 0} | &$sb | 
                    Select-Object -First $procToDisp | FT * -Auto 1> $pth
            } else {
                Get-CimInstance Win32_PerfFormattedData_PerfProc_Process | 
                    select @{Name='_PID_'; Expression={$_.IDProcess}},
                    @{Name='PPID'; Expression={$_.CreatingProcessID}},
                    @{Name='PrioB'; Expression={$_.PriorityBase}},
                    @{Name='Name                  '; Expression={(($_.Name).PadRight(22)).substring
                        (0, [System.Math]::Min(22, ($_.Name).Length))}}, 
                    @{Name='_CPUpt_N'; Expression={"{0,8:N2}" -f ($_.PercentProcessorTime / $TotProc)}},
                    @{Name='Thds'; Expression={$_.ThreadCount}},
                    @{Name='Hndl'; Expression={$_.HandleCount}},
                    @{Name='WS(MB)'; Expression={[math]::Truncate($_.WorkingSet/1MB)}},
                    @{Name='VM(MB)'; Expression = {[math]::Truncate($_.VirtualBytes/1MB)}},
                    @{Name='PM(MB)'; Expression={[math]::Truncate($_.PageFileBytes/1MB)}} |
                    where { $_._PID_ -gt 0} | &$sb | 
                    Select-Object -First $procToDisp | FT * -Auto 1> $pth
            }
    #>
    
    and replace it with Get-Counter version:
            $processes = Get-CimInstance Win32_PerfFormattedData_PerfProc_Process | 
                Select @{Name='_PID_'; Expression={$_.IDProcess}},
                @{Name='PPID'; Expression={$_.CreatingProcessID}},
                ElapsedTime, 
                @{Name='PrioB'; Expression={$_.PriorityBase}},
                @{Name='Name'; Expression={($_.Name).ToLower()}},
                @{Name='Thds'; Expression={$_.ThreadCount}},
                @{Name='Hndl'; Expression={$_.HandleCount}}, 
                @{Name='WS(MB)'; Expression={[math]::Truncate($_.WorkingSet/1MB)}},
                @{Name='VM(MB)'; Expression = {[math]::Truncate($_.VirtualBytes/1MB)}},
                @{Name='PM(MB)'; Expression={[math]::Truncate($_.PageFileBytes/1MB)}},
                PoolNonpagedBytes, PoolPagedBytes, PercentProcessorTime |
                Where { $_._PID_ -gt 0}
    
            $Samples = (Get-Counter “\Process(*)\% Processor Time”).CounterSamples

    Just noting Get-Counter example:
    PS:511 [HEL01]> (Get-Counter “\Process(*)\% Processor Time”).CounterSamples | FL *
    ...
    Path             : \\hel01\process(system)\% processor time
    InstanceName     : system
    CookedValue      : 0
    RawValue         : 3434062500
    SecondValue      : 131012088253272040
    MultipleCount    : 1
    CounterType      : Timer100Ns
    Timestamp        : 29.02.16 09:40:25
    Timestamp100NSec : 131012124253270000
    Status           : 0
    DefaultScale     : 0
    TimeBase         : 10000000
    Then I had to change the way of putting it all together:
            if ($CPUDSw) { 
                $pcts = $Samples | Select @{Name=”IName"; Expression={($_.InstanceName).ToLower()}}, 
                  @{Name=”CPUU”;Expression={[Decimal]::Round(($_.CookedValue), 2)}}
                $processes | select '_PID_', 'PPID', 'PrioB',
                                @{Name='Name                  '; Expression=
                                    {
                                        (($_.Name).PadRight(22)).substring(0, [System.Math]::Min(22, ($_.Name).Length))
                                    }
                                }, 
                                @{Name='_CPUpt__'; Expression=
                                    {
                                        if ($pcts.IName.IndexOf($_.Name) -ge 0) {
                                            ($pcts.CPUU[[array]::IndexOf($pcts.IName, $_.Name)]).ToString("0.00").PadLeft(8)
                                        }
                                    }
                                },
                'Thds', 'Hndl', 'WS(MB)', 'VM(MB)', 'PM(MB)' | &$sb | Select-Object -First $procToDisp | FT * -Auto 1> $pth
            } else {
                $pcts = $Samples | Select @{Name=”IName"; Expression={($_.InstanceName).ToLower()}}, 
                  @{Name=”CPUU”;Expression={[Decimal]::Round(($_.CookedValue / $TotProc), 2)}}
                $processes | select '_PID_', 'PPID', 'PrioB',
                                @{Name='Name                  '; Expression=
                                    {
                                        (($_.Name).PadRight(22)).substring(0, [System.Math]::Min(22, ($_.Name).Length))
                                    }
                                },  
                                @{Name='_CPUpt_N'; Expression=
                                    {
                                        if ($pcts.IName.IndexOf($_.Name) -ge 0) {
                                            ($pcts.CPUU[[array]::IndexOf($pcts.IName, $_.Name)]).ToString("0.00").PadLeft(8)
                                        } else {
                                            #Not found (yet). Take what you have :-/
                                            ($_.PercentProcessorTime).ToString("0.00").PadLeft(8)
                                        }
                                    }
                                },
                'Thds', 'Hndl', 'WS(MB)', 'VM(MB)', 'PM(MB)' | &$sb | Select-Object -First $procToDisp | FT * -Auto 1> $pth
            }
    Since Get-Counter, by default, takes samples 1 second apart:
    PS:507 [HEL01]> Measure-Command{(Get-Counter “\Process(*)\% Processor Time”).CounterSamples}
    
    Days              : 0
    Hours             : 0
    Minutes           : 0
    Seconds           : 1
    Milliseconds      : 18
    Ticks             : 10189709
    TotalDays         : 1.17936446759259E-05
    TotalHours        : 0.000283047472222222
    TotalMinutes      : 0.0169828483333333
    TotalSeconds      : 1.0189709
    TotalMilliseconds : 1018.9709
    I also abandoned all of the code relating to Timer:
        #$sw = New-Object Diagnostics.Stopwatch
        do {
            #$sw.Start()
    ...
            }
            #$sw.Stop()
            #if ($sw.ElapsedMilliseconds -lt 1000) {
            #    Start-Sleep -Milliseconds (1000-$sw.ElapsedMilliseconds)
            #}
            #$sw.Reset()
    
        } while ($true)
        #$sw = $null

    So now it works! I do not know right now when I will be able to release the new version so stay tuned.

    Final thoughts:

    I have hit many many problems in Windows during this testing. Just note, for example, the use of ToLower() in ($_.InstanceName).ToLower() but this is something for the new blog post. This one is about TOP script.

    2016-01-21

    Using Powershell to implement Linux top command on Windows

    Welcome to the final blog in Windows PerfCounters and Powershell series and sorry for the delay. The purpose of this blog is to explain the inner workings of top-script.ps1 script and practical usage of Performance counters on Windows through Powershell. It is intended for people who want Linux top - like tool on Windows.

    The script is a part of and available in our existing benchmarking package (dbt2-0.37.50.10) developed by Mikael Ronstrom.

    On Top:

    If you ever did benchmarking on Linux or simply wondered "where did all my resources go", top is your best friend. Since this post is not about Linux, you can google "Linux top explained" for more details.


    On Performance counters:

    To learn about Windows PerfCounters, please refer to my previous blog entries in this series. I will be addressing System.Diagnostics class as just Diagnostics.


    On Powershell:

    For ages, Windows users were looking at bash wondering why they do not have anything similar to it. After much trial and error, Microsoft delivered Powershell. In my humble opinion, Powershell is simply great! As per difference between Powershell and bash I would mention just one; Powershell pipe passes objects while bash pipe passes plain text.


    On script itself:

    Type "perfmon deleting files" in Google and you'll see why I made this script ;-) Joke aside, we have a mature testing/benchmarking framework written in bash and wanted the same look and feel on Windows. Top script is just the latest piece of that effort.
    I undertook this work since I firmly believe in native tools when dealing with performance issues. If I was just after measuring performance delatas between versions, some generic tool written for some other platform, such as in Perl or similar, would have been good enough. But, IMO, it would not have been fair to non-native OS.
    Also, studying native tools is an integral part of studying the OS itself which is something you can not tackle performance issues without.

    The script will evolve naturally to cover for the information we need in our everyday work.

    Using Windows performance counters through PowerShell CIM classes it is possible to gather stats on computer performance. The script functions like this:
      o Main code starts 2 background jobs; one for collecting details for header table ("Top_Header_Job") and one for processes table ("Top_Processes_Job").
      o Each of the jobs then collects stats and writes them into a file ("header" job to TempDir\headerres.txt file, "tasks" job to TempDir\thrprocstats.txt) which is, in turn, read by script main code. Main code uses TempDir\topcfg.txt to pass info to tasks (currently, the field to sort the table by). All of the files are overwritten each time so there is not much data in them.
      o After the files are read by main code, the data is displayed. To be able to properly position the output on screen, I used various [console] functions not available in PowerShell_ISE.


    Requirements:

    The script can not be run in _ISE. Use Powershell console.
    The script requires PS 3+.
    The script requires at least 50 x 80 console window.
    The script might work with .NET FW older than 4 but it was tested only with .NET 4.5.x.


    Getting started:

    1) Put script somewhere.
    2) Start PowerShell (NOT PS_ISE)
    3) cd to "somewhere" directory
    4) .\top-script.ps1
            a) Get-Help .\top-script.ps1
            b) Get-Help .\top-script.ps1 -Examples
    5) While script is running you can use (single key) shortcuts:
      q - Quit
      m - Sort by process WS (occupied RAM) DESC, CPUpt DESC
      p - Sort by process CPU utilization DESC, WS(MB) DESC; Non-Normalized/Normalized.
    Note: Script is started with CPU utilization by process as de-normalized (i.e. on multi-CPU boxes, this value can be well over 100%). To display normalized values (i.e. "non-normalized" value / # of CPUs), just press "p" again. IF non-normalized value is the source for data, the column title will be '_CPUpt__'. Normalized CPU utilization value (CPUpt / # of CPUs) will display as '_CPUpt_N'.
      n - Sort by process Name ASC
      r - Sort by process PID ASC, CPUpt DESC
      + - Display individual CPU's. Comma separated list of values (i.e. 0,1,2).
      1 - Display individual Processors (Sockets). Comma separated list of values (i.e. 0,1,2).
    Note: Script displays either Socket load or CPU load.
      - - Cancel displaying individual CPUs/Sockets.


    The output:

    09:21:17, Uptime:00d:00h:36m,  Users:  1,   # thds ready but queued for CPU: 0
    -------------------------------------------------------------------------------
    | RUNNING           | CPU                           | RAM[MB]                 |
    -------------------------------------------------------------------------------
    | services:    104  | Sys: 50.78%(P  4.30%/U 46.48%)| Installed:         8192 |
    | processes:   126  | Idle:49.22%                   | HW reserv:       320.77 |
    | threads:    1483  | HWint:             7087/0.38% | Visible:        7871.23 |
    | handles:   32696  | SWint:              278/0.38% | Available:         5136 |
    | CoSw/s:     6351  | High-prio thd exec:    50.38% | Modified:        117.07 |
    |                   | Total # of cores:           4 | Standby:        3936.44 |
    |                   |                               | PagesIn/Read ps:      2 |
    -------------------------------------------------------------------------------


    _PID_ PPID PrioB Name                      CPUpt Thds Hndl WS(MB) VM(MB) PM(MB)
    ----- ---- ----- ----                      ----- ---- ---- ------ ------ ------
     3916  852     8 mcshield                  10.14   53  490     46    225    100
     1836 5452     8 powershell#2               1.09   15  377     67    616     46
     7436 5452     8 powershell#1               0.72   17  556     85    624     67
     3984  156     8 WmiPrvSE                   0.72    9  303     14     56      9
     7024  156     8 WmiPrvSE#2                 0.72    7  201     10     52      7
     5452 5148     8 powershell                 0.36   18  454     90    628     79
     2292  852     8 FireSvc                    0.36   28  539     10    156     36
     7864 5148     8 thunderbird                0.00   52  630    293    656    264
     2880 5148     8 powershell_ise             0.00   12  427    181    869    164
     5148 3860     8 explorer                   0.00   25  810     81    267     53
     7028 6648     8 googledrivesync#1          0.00   29  712     76    193     64
     1124  852     8 svchost#5                  0.00   45 1560     46    187     31
     6508 5148     8 sidebar                    0.00   20  433     39    195     20
      816  796    13 csrss#1                    0.00   10  765     35    126      3
     6592 5148     8 iCloudServices             0.00   16  442     32    167     18
     6868 6764     8 pcee4                      0.00    7  202     32    612     32
     1976 1052    13 dwm                        0.00    5  135     31    140     26
     3400  156     8 WmiPrvSE#1                 0.00   12  297     28     91     22
     1088  852     8 svchost#4                  0.00   21  584     27    126     14
     3648  852     8 dataserv                   0.00   10  510     24    224     21
      980  852     8 svchost#2                  0.00   25  575     23    119     26
     2404  852     8 PresentationFontCache      0.00    6  149     21    506     28
    ...
    

    HEADER data

    Current time, uptime, # of active users, # of threads per CPU that are ready for execution but can't get CPU cycles (obviously, you want to keep this as low as possible (<= 2)).
            RUNNING section
                # of services in Started state
                # of user processes
                # of threads spawned
                # of handles open
                # of context switches per second
            CPU section
                % of CPU used (% used by privileged instr. / % used by user instr.)
                % of CPU consumed by Idle process.
                # of HW interrupts per sec./% of CPU used to service HW interrupts
                # of SW interrupts queued for servicing per sec./
                    % of CPU used to service SW interrupts
                % of CPU consumed by high-priority threads execution.
                # of phys. and virt. cores. Here, 4 is Dual-Core with HT enabled.
            RAM[MB] section
                Installed RAM.
                RAM reserved by Windows for HW.
                Amount of RAM user actually sees.
                Amount of available RAM for user processes.
                Amount of RAM marked as "Modified".
                Amount of RAM marked as "Standby" (cached).
                Ratio between Memory\Pages Input/sec and Memory\Page Reads/sec.
                    Number of pages per disk read. Should keep below 5.
    

    TABLE data

            _PID_    Unique identified of the process.
            PPID     Unique identifier of the process that started this one.
            PrioB    Base priority.
            Name     Name of the process.
            CPUpt    % of CPU used by process.
            Thds     # of threads spawned by the process.
            Hndl     # of handles opened by the process.
            WS(MB)   Total RAM used by the process. Working Set is, basically,
                the set of memory pages touched recently by the threads belonging
                to the process. 
            VM(MB)   Size of the virtual address space in use by the process.
            PM(MB)   The current amount of VM that this process has reserved for
                use in the paging files.
    

    Longer explanation of the values:

    HEADER:

    Foreword: Since Windows is not "process" based OS (like Linux) it is impossible to calculate the "System load". The next best thing is CPU queue length (see below).
      Uptime: Diagnostics.PerformanceCounter("System", "System Up Time")
      Users:  WMI query using query.exe tool which should be a part of your Windows.
               query user /server:localhost
               Number of users currently logged in. If no query.exe, the value is -1.
      # thds ready but queued for CPU:
              Diagnostics.PerformanceCounter("System", "Processor Queue Length")
               How many threads are in the processor queue ready to be executed but not
               currently able to use cycles. Windows OS has single queue length counter
               thus the value displayed is counter value divided with number of CPU's.
               Link.
    

        RUNNING section:
          services:
              (Get-Service | Where-Object {$_.Status -ne 'Stopped'} | Measure-Object).Count
               Total # of services actually running.
          processes:
              Diagnostics.PerformanceCounter("System", "Processes")
               Total number of user processes running.
               Link.
          threads:
              Diagnostics.PerformanceCounter("System", "Threads")
               Total # of threads spawned.
          handles:
              Diagnostics.PerformanceCounter("Process", "Handle Count")
               Total # of open handles.
          CoSw/s:
              Diagnostics.PerformanceCounter("System", "Context Switches/sec")
               Context switching happens when a higher priority thread pre-empts a lower
               priority thread that is currently running or when a high priority thread
               blocks. High levels of context switching can occur when many threads share
               the same priority level. This often indicates that there are too many
               threads competing for the processors on the system. If you do not see much
               processor utilization and you see very low levels of context switching, it
               could indicate that threads are blocked.
               Link.
    

        CPU section:
        Foreword: Windows OS has special thread called "Idle" which consumes free CPU cycles thus these counters return values relating to this one. Also, Windows are not "process" based but rather "thread" based so all of these numbers are approximations. This is even more important in the TABLE which shows CPU utilization per process (see explanation there). Most of these counters are multi-instance so instance name is '_Total' (ie. CPU utilization in total as opposed to per NUMA node, Core, CPU...).
          Sys: nn.nn%(P  mm.mm%/U zz.zz%):
              Diagnostics.PerformanceCounter("Processor Information","% Processor Time"),
               Diagnostics.PerformanceCounter("Processor Information","% Privileged Time"),
               Diagnostics.PerformanceCounter("Processor Information","% User Time").
               First number shows, effectively, % of cycles CPU(s) didn't spend running the
               Idle thread. Second number is the time CPU(s) spent on executing Privileged
               instructions while third is time CPU(s) spent executing user-mode instructions.
               For example, when your application calls operating system functions (say to
               perform file or network I/O or to allocate memory), these operating system
               functions are executed in Privileged mode.
               Link.
          Idle:
              Diagnostics.PerformanceCounter("Processor Information", "% Idle Time")
               Link.
          HWint:
              Diagnostics.PerformanceCounter("Processor Information","Interrupts/sec"),
               Diagnostics.PerformanceCounter("Processor Information","% Interrupt Time").
               Rate of hardware interrupts per second and a percent of CPU time this takes.
               Link.
          SWint:
              Diagnostics.PerformanceCounter("Processor Information","DPCs Queued/sec"),
               Diagnostics.PerformanceCounter("Processor Information","% DPC Time").
               Rate at which software interrupts are queued for execution and a % of CPU time
               this takes.
               Link.
          High-prio thd exec:
              Diagnostics.PerformanceCounter("Processor Information","% Priority Time").
               CPU utilization by high priority threads.
               Link: Can't find any links in MSDN...
          Total # of cores:
              (Get-CimInstance Win32_ComputerSystem).NumberOfLogicalProcessors
               Number of physical and virtual cores present.
    

        RAM[MB] section:
          Installed:
              (GCIM -class "cim_physicalmemory" | Measure-Object Capacity -Sum).Sum/1024/1024
          HW reserv:
              Installed - Visible ;-)
          Visible:
              (Get-CimInstance win32_operatingsystem).TotalVisibleMemorySize
          Available:
              Diagnostics.PerformanceCounter("Memory","Available MBytes")
          Modified:
              Diagnostics.PerformanceCounter("Memory","Modified Page List Bytes")
          Standby:
              Diagnostics.PerformanceCounter("Memory","Standby Cache Core Bytes") + 
               Diagnostics.PerformanceCounter("Memory",
                 "Standby Cache Normal Priority Bytes") + 
               Diagnostics.PerformanceCounter("Memory","Standby Cache Reserve Bytes")
               Basically, cache memory.
          PagesIn/Read ps:
              Diagnostics.PerformanceCounter("Memory","Pages Input/sec")/ 
               Diagnostics.PerformanceCounter("Memory","Page Reads/sec")
               Ratio between Memory\Pages Input/sec and Memory\Page Reads/sec which
               is number of pages per disk read. Should keep below 5.


    TABLE:

    Foreword: Windows is not "process" based OS (like Linux) but rather "thread" based so all of the numbers relating to CPU usage are approximations. I did made a "proper" CPU per Process looping and summing up Threads counter (https://msdn.microsoft.com/en-us/library/aa394279%28v=vs.85%29.aspx) based on PID but that proved too slow given I have ~1 sec to deal with everything. CPU utilization using RAW counters with 1s delay between samples proved to produce a bit more reliable result than just reading Formatted counters but, again, too slow for my 1s ticks (collect sample, wait 1s, collect sample, do the math takes longer than 1s). Thus I use PerfFormatted counters in version 0.9RC.
        Win32_PerfRawData_PerfProc_Process; Win32_PerfFormattedData_PerfProc_Process
        Link.
      
        _PID_     Unique identified of the process.
        PPID      Unique identifier of the process that started this one.
        PrioB     Base priority.
        Name      Name of the process.
        CPUpt_(N) % of CPU used by process. On machines with multiple CPUs,
            this number can be over 100% unless you see _CPUpt_N caption which
            means "Normalized" (i.e. CPUutilization / # of CPUs).
            Toggle Normal/Normalized display by pressing the "p" key.
        Thds      # of threads spawned by the process.
        Hndl      # of handles opened by the process.
        WS(MB)    Total RAM used by the process. Working Set is, basically,
            the set of memory pages touched recently by the threads belonging to
            the process. 
        VM(MB)    Size of the virtual address space in use by the process.
        PM(MB)    The current amount of VM that this process has reserved
            for use in the paging files.
    
    Note that it is possible to display CPU/Socket data for chosen HW by pressing + or 1 keys, entering 0-based index and separating multiple values by ,:
    
             User  Priv  Idle  HWin  SWIn              User  Priv  Idle  HWin  SWIn
    -------------------------------------     -------------------------------------
    %CPU  0:   47,    5,   47,    0,    0     %CPU  1:    0,    0,  100,    0,    0
    %CPU  2:   35,   11,   52,    0,    0     %CPU  3:    5,    0,   94,    0,    0
    
    The input here was 0,1,2,3 thus displaying data about first 4 cores. The CPU/Socket data is displayed between the Header and the Table areas reducing the number of visible processes. To remove this information from screen, just press "-" key.

    INNER WORKINGS:

    In general, script output comprises of Header part and Table part showing details on processes. In-between the two, you can show Processor/Core info. There are two background jobs started to accomplish this; "Top_Header_Job" & "Top_Processes_Job". The data about individual processors/cores is calculated in main script body.

    Script starts with my usual checks, proceeds to variable declaration part where I initialize some of the performance counters (which takes time) and then starts Header and Processes jobs. The jobs itself follow the same logic. I.e. I first start perfcounter instances (which takes time) and then loop through values passing them back in file.

    Main script body collects the data from files refreshing the display. Also, main script is in charge of displaying individual processor/core data as well as monitoring the keyboard input. This means CTRL+C will NOT work but you can still stop the script with CTRL+BREAK:
    [console]::TreatControlCAsInput = $true
    Regular way to exit is pressing the "q" key.
    After you press the "q" key, cleanup code is executed, stopping the background jobs and removing temporary files used for communication. It's worth noting that cleanup code does not throw any errors. This is because nothing bad can happen. Files are less than 1kB in total while background jobs can be stopped either via trick described below or simply by exiting Powershell console.

    Lets go deeper into the regions of code now. First region is Check which I described in October 2015 blog so no need to repeat myself. Next is Variable Declarations region where I gather one-time top-level data, mainly related to CPU topology using tricks described in Blog 3 and Blog 4 by manipulating Instances as described in Blog 1 of this series. Executing this part takes couple of seconds.

    Next thing is to start the Header job. It takes argument (total number of cores) from the call and proceeds with initializing various counters. As with all initializations, this also takes couple of seconds. Main DO loop starts the timer to ensure samples are collected in 1 second intervals. Also, it checks if you have query.exe tool installed and determines the number of active users, if the tool exists, or displays -1 if it doesn't. There are other ways of determining number of logged users but they are all too slow for 1s tick. After forming the resulting lines, I use [System.IO.StreamWriter] to record them to Env:\TEMP headerres.txt file. The control is then returned to main script which waits for Env:\TEMP headerres.txt file (or 20s, whichever comes first).

    Next step is to start the Tasks job which will collect data about running processes. As opposed to Task manager, I show background processes (ie. services) too. Worth noting is that, due to timing issues, I use Process (Win32_PerfFormattedData_PerfProc_Process) and not Thread (win32_PerfFormattedData_PerfProc_Thread) counters.
    Since Windows is *thread* based (meaning a Process is just a container for Threads doing the work) this actually means scarifying some of the accuracy (for example CPU utilization data) in favour of faster and smoother execution:
    #(Active) Code when using Process counter:
        Get-CimInstance Win32_PerfFormattedData_PerfProc_Process | 
            Select @{Name='_PID_'; Expression={$_.IDProcess}},
            @{Name='PPID'; Expression={$_.CreatingProcessID}},
            @{Name='PrioB'; Expression={$_.PriorityBase}},
            @{Name='Name                  '; Expression={
                (($_.Name).PadRight(22)).substring(0, [System.Math]::Min(22, ($_.Name).Length))
            }}, 
            @{Name='_CPUpt__'; Expression={($_.PercentProcessorTime).ToString("0.00").PadLeft(8)}},
            @{Name='Thds'; Expression={$_.ThreadCount}},
            @{Name='Hndl'; Expression={$_.HandleCount}},
            @{Name='WS(MB)'; Expression={[math]::Truncate($_.WorkingSet/1MB)}},
            @{Name='VM(MB)'; Expression = {[math]::Truncate($_.VirtualBytes/1MB)}},
            @{Name='PM(MB)'; Expression={[math]::Truncate($_.PageFileBytes/1MB)}} | #,
            Where { $_._PID_ -gt 0} | &$sb | 
                Select -First $procToDisp | FT * -Auto 1> $ToFile 
    Note: Script-block $sb is used just for sorting the resultset depending on keyboard input.
    Note: "Name=" is the same as writing "Label=". Both can be abbreviated so the expression becomes @{L=...";"E={...}}.

    #(More precise but slower) Code when scanning recursively the Thread counter:
        #Get the CPU utilization percentages by summing up threads over particular process
        $pcts = Get-CimInstance win32_perfformatteddata_perfproc_thread -Property IDProcess,
          PercentProcessorTime | Group -Property IDProcess | Foreach {
            New-Object PSObject -Property @{
              PID = ($_.Group.IDProcess | Select -First 1)
              CPUpt = "{0,5:N2}" -f (($_.Group | Measure-Object -Property PercentProcessorTime -Sum).Sum)
            }
          }
    
        #Pair with Process data:
        Get-CimInstance Win32_PerfFormattedData_PerfProc_Process | 
          Select @{Name='_PID_'; Expression={$_.IDProcess}},
          @{Name='PPID'; Expression={$_.CreatingProcessID}},
          @{Name='PrioB'; Expression={$_.PriorityBase}},
          @{Name='Name'; Expression={($_.Name).PadRight(25)}},
          @{Name='CPUpt'; Expression={$pcts.CPUpt[[array]::IndexOf($pcts.PID, $_.IDProcess)]}},
          @{Name='Thds'; Expression={$_.ThreadCount}},
          @{Name='Hndl'; Expression={$_.HandleCount}},
          @{Name='WS(MB)'; Expression={[int]($_.WorkingSet/1MB)}},
          @{Name='VM(MB)'; Expression = {[int]($_.VirtualBytes/1MB)}},
          @{Name='PM(MB)'; Expression={[int]($_.PageFileBytes/1MB)}} | 
          Where { $_.Name -notmatch "_Total" -and $_.Name -notmatch "Idle"} | &$sb |
            Select -First $procToDisp | FT * -Auto 1> $ToFile 
    Note: Script-block $sb is used just for sorting the resultset depending on keyboard input.

    There is one more way of doing this and that is by expanding Process perf object. I use this approach when checking for congestion on thread level (MSDN):
    #Run once:
    #Header row, initialize output file:
    "PID,Process,ThdID,CPU time (s),PctUser,PctPriv,State,WaitR,PrioLvL,PrioShift,IdealProc,ProcAff" |
      Out-File E:\test\thds.csv
    #PIDs of interest to me:
    $Processes = Get-Process | 
      Where {($_.ProcessName -match "mysql") -or ($_.ProcessName -match "ndb") -or ($_.ProcessName -match "sysben")} |
      Sort -Property ID
    
    Note: If you check the value of $Processes variable here, you will notice something like
    Id                         : 1996
    ...
    Threads                    : {2000, 2012, 2016, 2040...}
    ...
    meaning Threads member is actually an object and can be expanded to show more data:
    PS > $Processes.Threads
    
    BasePriority            : 8
    CurrentPriority         : 9
    Id                      : 1972
    IdealProcessor          : 
    PriorityBoostEnabled    : 
    PriorityLevel           : 
    PrivilegedProcessorTime : 
    StartAddress            : 2006300688
    StartTime               : 
    ThreadState             : Wait
    TotalProcessorTime      : 
    UserProcessorTime       : 
    WaitReason              : UserRequest
    ProcessorAffinity       : 
    Site                    : 
    Container               : 
    ...
    #Run following in loop, append result to file
    #Threads belonging to PIDs of interest.
    Foreach ($Process in $Processes) {
        $ProcessThds = $Process | Select -ExpandProperty Threads | Sort -Property ID
        Foreach ($ProcessThd in $ProcessThds) {
            $ProcName = @{L="Name";E={ $Process.ProcessName}}
            $ProcID = @{L="PID";E={ $Process.Id}}
            $ThdID = @{L="ThreadID";E={ $ProcessThd.Id }}
            $CPUTime = @{L="CPU Time (Sec)";E={ [math]::round($ProcessThd.TotalProcessorTime.TotalSeconds,2) }}
            $UsrCPUTime = @{L="User CPU Time (%)";E={ [math]::round((($ProcessThd.UserProcessorTime.ticks /
              $ProcessThd.TotalProcessorTime.ticks)*100),1) }}
            $State = @{L="State";E={ $ProcessThd.ThreadState }}
            $WR = @{L="WaitR";E={ $ProcessThd.WaitReason}}
            $PrioDelta = @{L="PrioSh";E={ $ProcessThd.CurrentPriority - $ProcessThd.BasePriority}}
            $IdProc = @{L="Ideal proc";E={ $ProcessThd.IdealProcessor}}
            $ProcAf = @{L="Proc affinity";E={ $ProcessThd.ProcessorAffinity}}
            $PrioLvL = @{L="Prio level";E={ $ProcessThd.PriorityLevel}}
            $PrivCPU = @{L="Privil CPU";E={ [math]::round((($ProcessThd.PrivilegedProcessorTime.ticks /
              $ProcessThd.TotalProcessorTime.ticks)*100),1) }}
            $ProcessThd | Select -Property  $ProcName, $ProcID, $ThdID, StartTime, $CPUTime, $UsrCPUTime, $PrivCPU, 
                $State, $WR, $PrioLvL, $PrioDelta, $IdProc, $ProcAf |
            %{'{0},{1},{2},{3},{4},{5},{6},{7},{8},{9},{10},{11}' -f $_.PID,$_.Name, $_.ThreadID,$_."CPU Time (Sec)",
            $_."User CPU Time (%)",$_."Privil CPU",$_.State,$_.WaitR,$_."Prio level",$_.PrioSh,$_."Ideal proc",
            $_."Proc affinity"} | Out-File E:\test\thds.csv -Append
        }
    }
    This leaves me with neat little CSV file which I then import to Excel and group by Process ID for further analysis.


    Back to main script, region Main-start, where I wait for Processes job to start producing data before proceeding. If there is no data generated, the script will stop the jobs and exit.
    Next is the neat trick to reduce the flicker while clearing up the screen:
    [System.Console]::Clear()
    and positioning the cursor at top left corner:
    $saveYH = [console]::CursorTop
    $saveXH = [console]::CursorLeft

    Worth noting here, in terms of reduced flicker, is hiding the cursor itself:
    [console]::CursorVisible = $false

    After that, you enter region Main-loop which is the main code for the script. If there is fresh header data to be displayed, I move cursor to (0,0) and write it out. Otherwise, I skip this and check if I should display Core/Socket data. The problem here is that user can specify any number of cores/sockets to display data for and I display two of them in each line. Thus I need an array where user input is mapped to absolute index of the requested piece of HW in perf counter. The array is created in key-press handler. For the sake of performance, both core and socket counters were initialized at the start of the script:
    #Just the individual CPUs.
    $CPUdata = Get-CimInstance Win32_PerfFormattedData_Counters_ProcessorInformation | Where {$_.Name -match "^(\d{1}),(\d{1})"}
    #Just the individual Sockets.
    $Socketdata = Get-CimInstance Win32_PerfFormattedData_Counters_ProcessorInformation | Where {$_.Name -match "^(\d{1}),_Total"}

    Then, if there is fresh data provided by Top_Processes_Job, I display it.

    Next comes the keyboard handling routine. First, check that there is something to handle:
      if ($Host.UI.RawUI.KeyAvailable) {
    If there is, put it into variable:
        $k = $Host.UI.RawUI.ReadKey("AllowCtrlC,IncludeKeyDown,IncludeKeyUp,NoEcho").Character
    Once the keypress is processed, clear the input buffer:
        if ("p" -eq $k) {
          'CPUpt' > $conf
          $HOST.UI.RawUI.Flushinputbuffer()

    "+" and "1" keys process input of CPUs/Sockets to display data for, while "-" key stops displaying that data.
    Pressing "c" key will clear the screen in case it becomes garbled.
    Pressing "q" key moves you to region Cleanup ending the script run.


    TIPS & TRICKS

    As opposed to Windows TaskManager, I show background processes too (ie. "services").

    In an effort to achieve smoother display of data, I am truncating CPU/Socket info to their integer values. Also, I do not use Thread counters but rather Process ones. Due to delay while displaying the data, there will always be some discrepancy between data displayed. I.e. Total CPU utilization in Header will rarely match sum of CPU utilization by processes in table. I can live with that.

    Script is started in non-normalized CPU utilization mode which means CPU utilization per process can go well over 100% on modern boxes. Let's say you have Quad core box (8 CPUs) and a process taking 50% of Core0, 60% of Core1, 30% of Core2 and 20% of Core3 then the non-normalized CPU utilization for such process would be 160% while normalized CPU utilization would be 20% (160/8). I did it as such to confirm that process actually uses more than one CPU. To toggle between non-normalized and normalized view, use "p" key.

    If, for any reason, display becomes garbled, press the "c" key.

    Number of processes to display is controlled by $procToDisp variable which is, atm, hard-coded to 25.

    Initial sort order is defined by $procSortBy variable. Default is CPU% ($procSortBy = 'CPUpt').

    IF by any chance script does not terminate normally:
    - First type Get-Job
    - Check that Name has "Top_Header_Job" & "Top_Processes_Job". Remember the Id (or use Name parameter).
    Say Id's are 14 and 16.
    - Type commands (text after # is just a comment):
    [console]::CursorVisible = $true #reclaims the cursor
    [console]::TreatControlCAsInput = $false #reverts CTRL+C processing to default value
    receive-job -id 14
    receive-job -id 16
    stop-job -id 16
    stop-job -id 14
    remove-job -id 14
    remove-job -id 16

    or just exit the Powershell window.


    Hope you'll find this script useful in your work!


    This is all from me for this series. Next, I will start new series of blogs describing script used as testing/benchmarking framework on Windows which is also available in the package.